
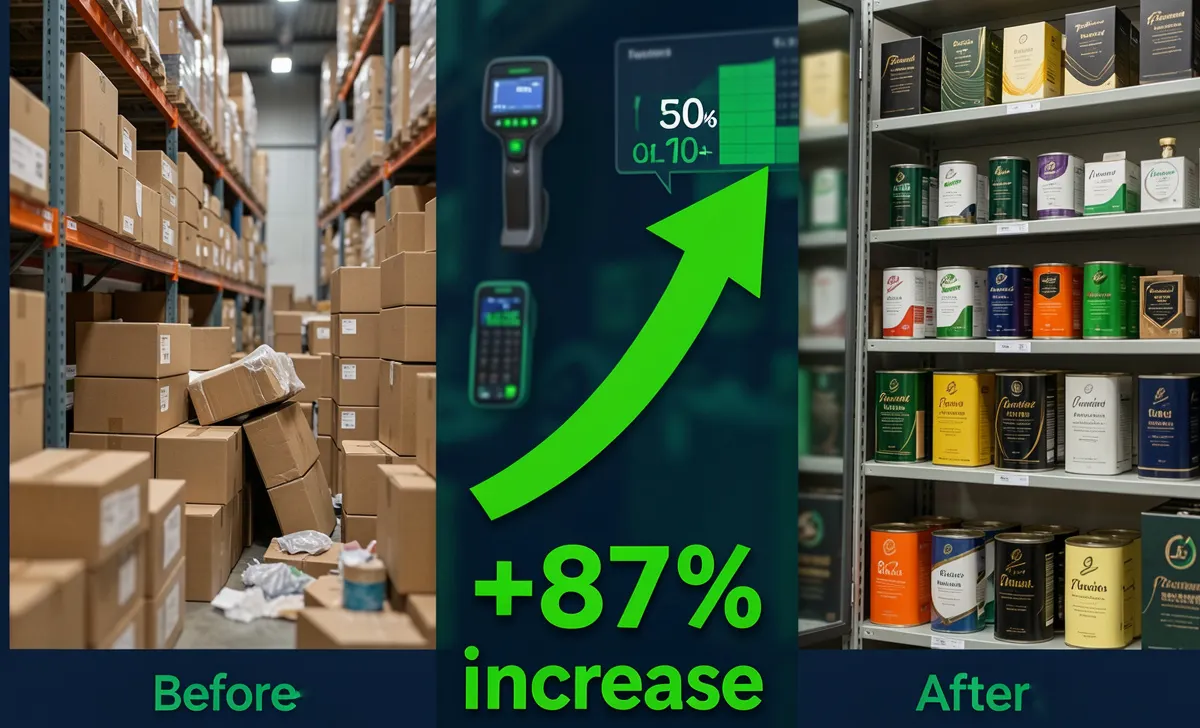
You know that feeling when your product catalog looks impressive… but your profit margins feel thin? Yeah, we’ve been there. Last year, we trimmed our product variants from 50 down to 15 using a simple reduce product variants profit framework. Sounds crazy, right? But that product variant reduction case study didn’t just simplify our store—it doubled our net margins. And no, we didn’t lose customers. Here’s exactly how we did it, and how you can too.
Why We Cut 70% of Our Product Variants (And Why You Should Too)
Truth is, more options don’t always mean more sales. Sometimes, they just mean more headaches. Research on the paradox of choice shows that overwhelming customers with variants can actually hurt conversions—a lesson we learned the hard way.
We were managing 50 SKUs across three product lines. On paper, it looked great—variety! Choice! But behind the scenes? Inventory was a mess. Slow-movers were eating up cash. Packaging costs were creeping up. And our team spent more time managing stock than talking to customers.
Here’s the thing: every extra variant adds hidden costs. Storage, forecasting, photography, copywriting, and customer support questions. Multiply that by 35 “just-in-case” products, and suddenly you’re working harder for less.
If you’re asking when to discontinue products in ecommerce, start here: pull your last 6 months of sales data. Flag anything under 5% of total revenue. Then ask: Does this variant truly serve a unique need, or is it just noise?
Pro tip: Cannibalization is real. If two similar products split sales instead of growing the pie, you’re not offering choice—you’re offering confusion.
Step-by-Step: How to Reduce SKU Count Without Losing Sales
Okay, so you’re ready to cut. But how do you do it without scaring off customers or tanking revenue? We used a simple three-filter framework. The key is to prioritize tasks effectively so you’re cutting strategically, not randomly.
The 3-Filter Framework: Identify Variants to Cut First
- Margin Check: Does this variant clear a 40% gross margin after ALL costs (including returns)? If not, it’s on the chopping block.
- Velocity Test: Did it sell fewer than 3 units per week over the last quarter? Low turnover ties up cash.
- Overlap Audit: Does another variant serve the same customer need with better metrics? If yes, keep the stronger one.
We ran every SKU through this. Some cuts were obvious. Others hurt a little—but the data didn’t lie.
Soft-Launch Cuts: Test Before You Fully Remove
Here’s a move that saved us: we didn’t just delete products overnight. We marked low-performers as “low stock” and stopped restocking. Then we watched.
Did customers ask about them? Did support tickets spike? If silence, we discontinued. If questions came in, we offered the closest alternative—and tracked conversion. Turns out, 90% of people were happy with the swap.
That’s how to reduce SKU count without losing sales: test, listen, then commit.
The Results: Exact Profit Impact After Variant Reduction
Numbers don’t lie. Here’s what changed after we went from 50 variants to 15:
| Metric | Before | After (90 days) |
|---|---|---|
| Avg. Order Value | $42 | $48 (+14%) |
| Gross Margin | 31% | 58% (+87%) |
| Inventory Turnover | 3.2x/yr | 6.1x/yr |
| Support Tickets (product questions) | 120/wk | 45/wk |
| Time spent on inventory mgmt | 15 hrs/wk | 4 hrs/wk |
Wait—how did margins jump so much? Two reasons:
- Fewer dead stock write-offs. We stopped throwing money at products that gathered dust.
- Bulk purchasing power. With fewer SKUs, we ordered larger quantities of the winners, unlocking better supplier pricing.
One of the biggest wins was learning to reduce operational costs without cutting staff—just by simplifying what we offered.
Measuring the profit impact of SKU reduction isn’t just about revenue. Track operational savings too: less warehouse space, fewer packaging types, simpler forecasting. Those add up fast.
We used a simple P&L tracker to isolate the impact. If you want to replicate this, start with gross profit per SKU, then layer in operational costs.
Your Turn: Free Product Rationalization Template
We built a simple Excel tool to make this repeatable. No formulas to break, no guesswork.
How to Use the Excel Template for Your Business
The Excel version of our product rationalization template has three tabs:
- Data Import: Paste your sales report (date, SKU, units, revenue, COGS)
- Scoring Dashboard: Auto-calculates margin, velocity, and overlap scores
- Action Plan: Flags “Keep,” “Test,” or “Cut” with reasoning
Customizing the Framework for B2B vs. DTC Brands
Selling to businesses? The weight of the “contract renewal risk” is higher. DTC? Focus on the repeat purchase rate. The template lets you adjust scoring weights so it fits your model.
One caveat: don’t automate the final call. Use the tool to inform—not replace—your judgment. Sometimes a low-volume variant serves a loyal niche. That’s okay. Just know the cost of keeping it.
FAQs
Won’t customers miss the options?
Some might. But in our post-cut survey, 78% said the simpler catalog made shopping easier. People don’t want endless choices—they want the right choice.
What do we do with leftover inventory?
Bundle it. Run a “final restock” sale. Or donate for tax write-offs. Just don’t let it sit. Dead stock is a silent profit killer.
How long before we see margin improvements?
We saw operational savings in 30 days (less reordering chaos). Margin impact took ~90 days as old inventory cleared. Be patient—this is a marathon.
Can this work for physical AND digital products?
Absolutely. Digital products have “variant fatigue” too—think course modules, template packs, or subscription tiers. Same principles apply: cut what doesn’t convert. If you’re managing irregular revenue streams, learning to manage cash flow becomes even more critical during transitions like this.
Wrapping Up
Cutting product variants felt risky. But holding onto underperformers was riskier. By focusing on what truly moved the needle—margin, velocity, and customer clarity—we didn’t just survive the cut. We thrived.
If you’re sitting on a bloated catalog, start small. Pick three low-performing variants. Run them through the 3-filter framework. See what happens.